PulseGuardMONITORING • OBSERVABILITY

Know what changed before your users do.

Real-time observability for modern systems. Detect issues, own incidents, and ship with confidence.
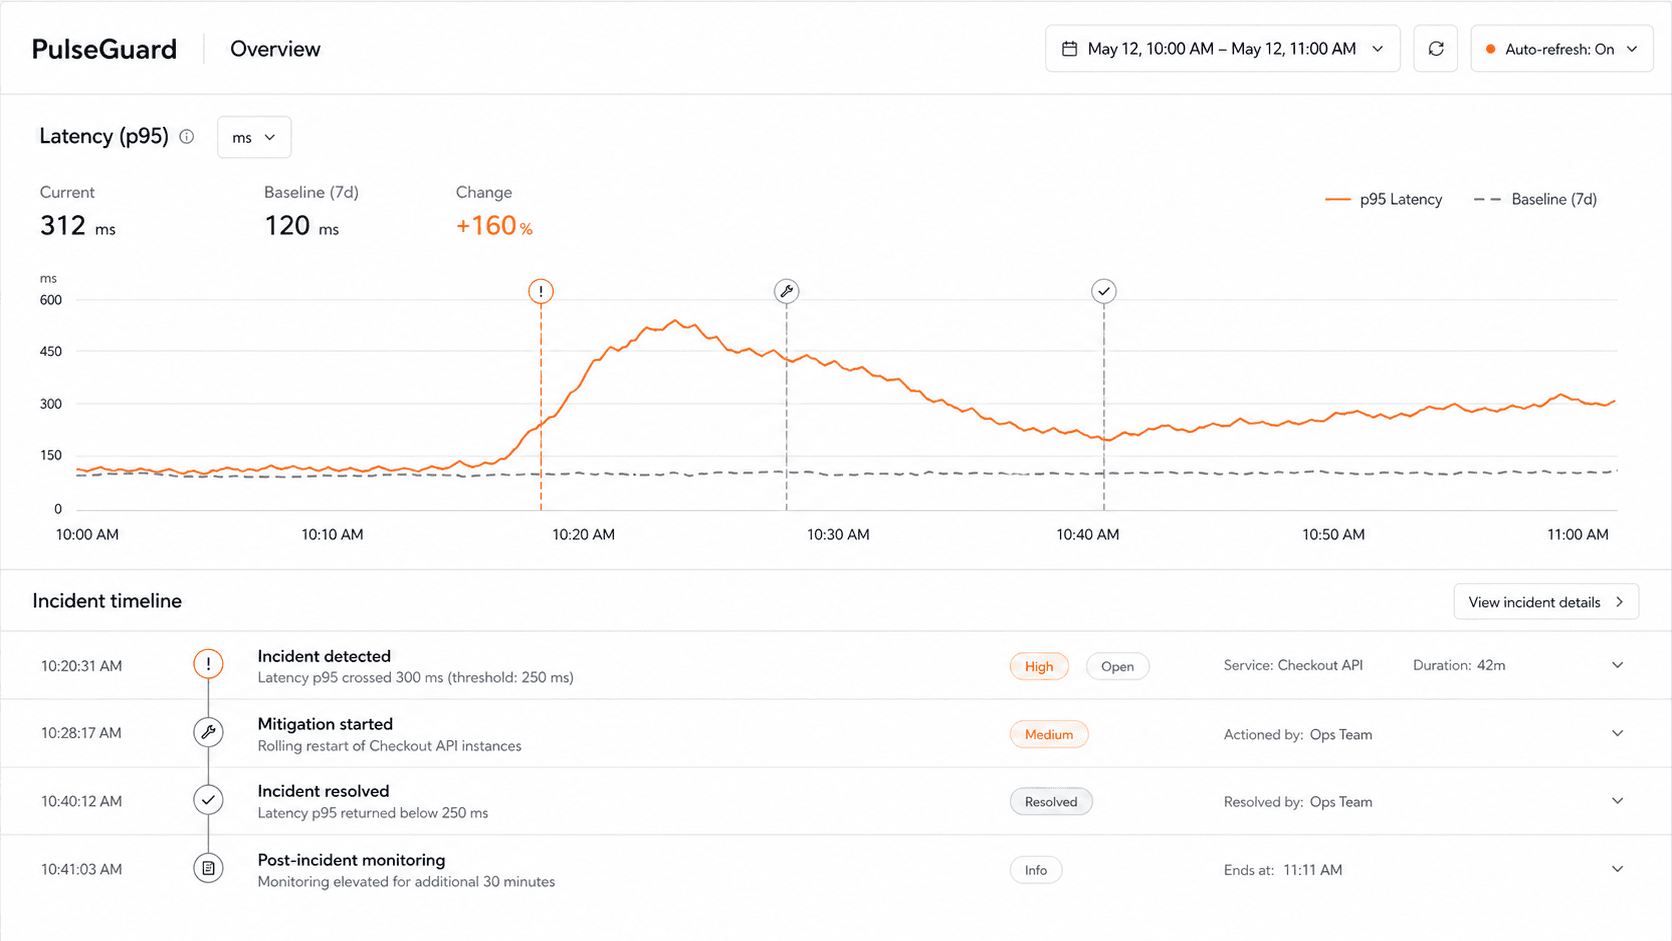
PulseGuard incident overview

Instrument once

Follow the request everywhere it goes.

Start with a few lines. PulseGuard handles the context that makes every event useful.

import { TelemetryProvider } from "pulseguard";

export default function RootLayout({ children }) {
  return <TelemetryProvider dsn="https://pg_key@api.pulseguard.dev/project-id">
            {children}
         </TelemetryProvider>;
}

Pipeline in motion

Unified telemetry for modern cloud infrastructure.

Generate logs, traces, and metrics in one flow. The collector batches each signal and routes it to the tools your team already understands.

PulseGuard pipeline engine

Next
Application
OTel
Logs
Traces
Metrics
Grafana

Simulate events:

CPU38%
Requests140/m
Errors0

pipeline >Initializing pipeline integration...

Everything starts with signals.

Five focused ways to see what your software is doing.

overview dashboard preview

Test the signal

See what arrives.

Generate a signal and inspect the context PulseGuard keeps with it.

Dispatch a signal to inspect the payload.

Pipeline architecture

Follow every signal through the stack.

Select a node to see how telemetry moves from your application to the place where your team investigates it.

The next incident should not be a mystery.

Frequently asked questions.

Everything you need to know about context propagation, instrumentation, and the observability stack.

Install the pulseguard npm package and pass the project DSN from the Connect tab. Customer apps authenticate with that key, not your PulseGuard login.
OpenTelemetry is a vendor-neutral standard for collecting logs, traces, and metrics. PulseGuard integrates with OTel SDKs in your frontend and backend services, then routes the captured data through its collector into structured log, trace, and metric pipelines.
PulseGuard buffers telemetry and sends it in non-blocking micro-batches. If a network interruption occurs, the local buffer sheds older logs gracefully so your application can preserve its core CPU and memory resources.
PulseGuard propagates trace context through your services and attaches the trace identifier to the relevant log records. That correlation lets you move from a timeout line to its full request waterfall without manually joining separate systems.
Yes. The collector, Loki, Tempo, Prometheus, and Grafana are containerized and can be deployed on a managed cluster with standard Helm charts or Docker Compose templates.
No. PulseGuard provides tested collector and data-source configuration so the common pipelines and correlations are already in place when you begin instrumenting your services.